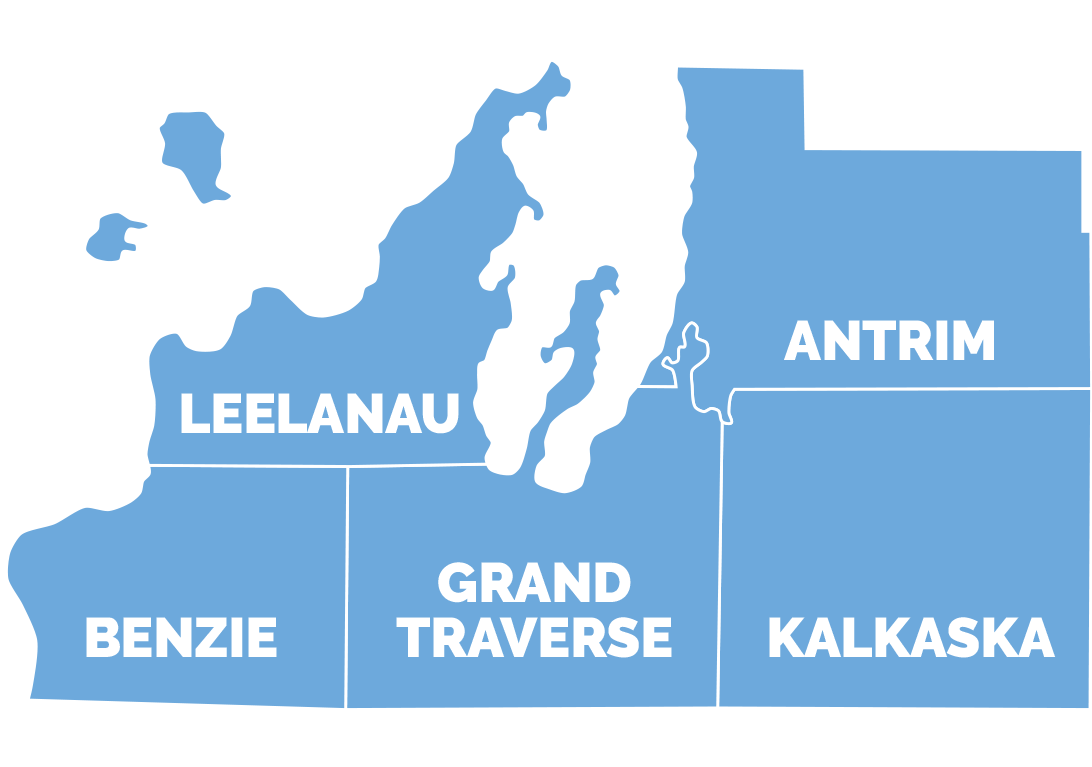
For the first half of 2021, Grand Traverse County has seen over double the commercial sales volume and number of lease transactions compared to this time last year. Marketing time (days on market) has decreased by two weeks. The number of commercial sales transactions has increased from 26 to 38.

Currently, there are 116 commercial properties for sale in Grand Traverse County. The average list price for sale is $627,137, which is higher than last years of $406,488, and inline with 2019’s average list price of $642,606. The average sale price this year is $563,336, representing an 11% discount to the property’s average asking price of $627,137. While asking prices have gone back to pre-pandemic numbers, sellers are accepting offers at larger discounts than previous years.
In the first half of 2020, our highest reported sale was $1,800,000 for the previous Bill Marsh auto dealership at 3536 N US-31 S and in 2021, our record sale was slightly higher at $1,950,000 for a two-story office building located at 534 E Front St.
Shown in the table below, sales transactions for industrial/warehouse buildings have almost doubled, offices almost tripled, and retail has decreased by half.

Another market trend that we look at is the length of time it takes to sell a property. In 2014, we averaged 445 days and in Q1-Q2 of 2021, we are down to 223 days. This represents a 50% decrease in the average time it takes to sell a property since 2014.

Although commercial properties’ days on the market are significantly longer than residential properties, the change has been significant since properties in our area are selling in less than half the time than 6+ years ago. When buyers see a good property with a fair asking price, they are moving much more quickly to make an offer and close on the property.
Trending with sales, leasing activities have also seen more activity in 2021 compared to the last three years. This year, there have been 71 leases reported in the MLS with an average sale price of $14.63/SF/YR, while 2020 only had 33 with an avg. sale price of $15.56/SF/YR. The area is seeing a strong increase in lease numbers and total sq. ft. leased across the markets, while prices per square foot have slightly decreased (see table below). The largest jump in leases has been for industrial space, but both office and retail are up from two years ago. Perhaps it is due to new people moving to the area and starting new businesses.

Overall, the largest difference between the first half of 2020 and 2021 are total sales volume and signed leases. Total sales volume for the first half of 2021 was $21,406,752 vs $9,793,600 in 2020. When we compare total sales volume by category (industrial/warehouse, office, and retail), all have significantly improved since last year except retail. In 2021, retail property sales declined by 50%; but in 2020, it was the only category to have increased in sales volume and number of transactions.
In 2019, the commercial real estate industry in the area was influenced by the hopes of recreational marijuana sales; in 2020, we began the second quarter in a pandemic; and in 2021, we have seen a new President take office and declining COVID-19 cases affecting our area. It will be interesting to see how the 2021 market closes out and what, if any, new factors shape the commercial real estate market in 2022.
Kayla Anderson, D.M.S. & D.S.A.
*NOTE: THESE FIGURES DO NOT INCLUDE COMMERCIAL VACANT LAND OR MULTI-FAMILY PROPERTIES.
 Facebook
 X
X
 Pinterest
 Copy Link
